
Connor Lincavicks ’24
Business Management Senior Looks Forward to Career in Esports

At the University of New Haven, everything from our distinguished academic programs to our professors’ commitment to fostering professional development is designed to propel students into their careers. Our unique educational approach provides students with the skills, tactical experience, and network to become tomorrow’s pioneers.
At the University of New Haven, everything from our distinguished academic programs to our professors’ commitment to fostering professional development is designed to propel students into their careers. Our unique educational approach provides students with the skills, tactical experience, and network to become tomorrow’s pioneers.
Our New Look
We have updated our homepage to reflect our new brand. We are working diligently to incorporate the new look and feel across our website. More updates are coming. Power on!
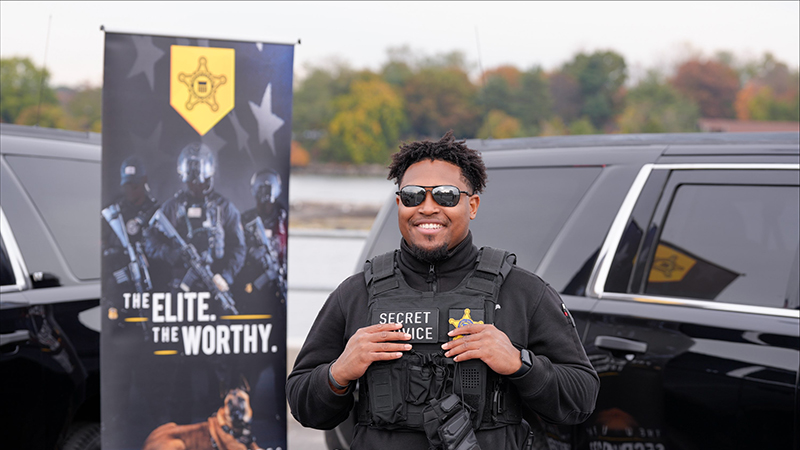
University’s Criminal Justice Career Expo Brings Together Students and Alumni
Charger alumni who work for the FBI, Drug Enforcement Agency, U.S. Secret Service, local and state police forces across the state and region, and reformative justice nonprofits returned to campus for a career fair. They shared their insights and guided students through the hiring process.
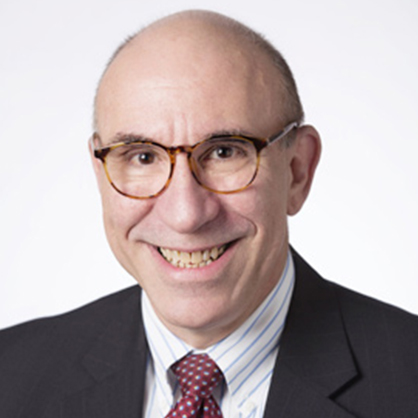
Peter Valentin, associate professor of forensic science, explains the ‘order of operation’ when it comes to forensic science testing in criminal investigations.
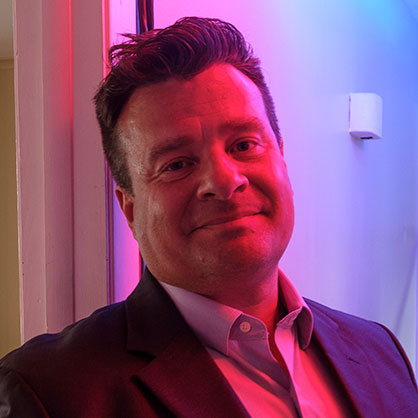
John DeCarlo, professor and director of the Master’s Program in Criminal Justice, comments on the number of public service employees working overtime in Southington as shortages continue to be an issue throughout the state.
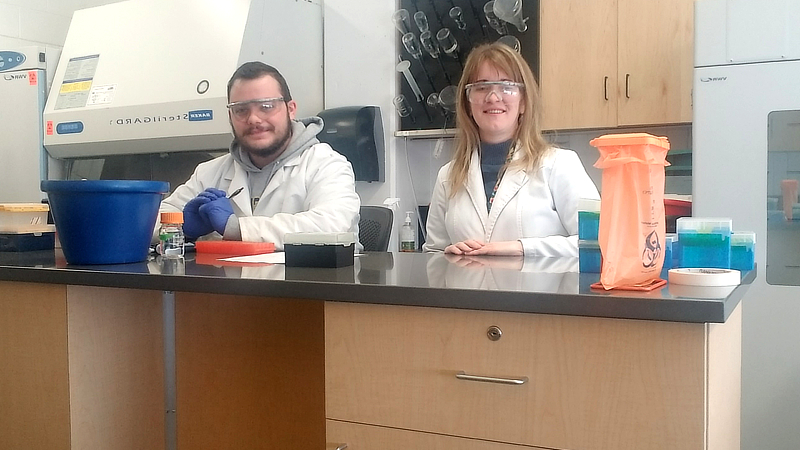
Whether he was gaining hands-on experience on campus at an international company, Brendan Straut '24 has built his laboratory skills and his confidence throughout his time as a Charger. He's excited to begin his master's degree at the University this fall.
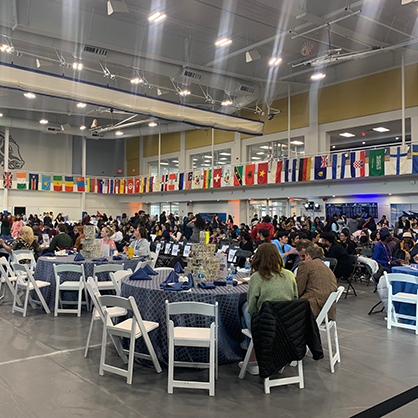
The University’s recent Graduate Appreciation Week included a variety of exciting and interactive events, including the University’s much anticipated International Festival. Students say the week was a great way to connect with their fellow Chargers.


Business Management Senior Looks Forward to Career in Esports
Senior Reflects on ‘Rewarding’ Make-A-Wish Connecticut Internship, Gaining Professional Experience as a Charger
'My Time at the University of New Haven Has Been Instrumental in Preparing Me for Success'
Find out more about why the University of New Haven is a great fit for you. Our admissions team will contact you with information personalized to your interests.
A campus visit is one of the most important parts of the college selection process. Come feel what it's like to Be a Charger!
With more than 68,000 alumni and more than 100 years of history, #ChargerNation is the place to be. Begin Your Journey today.
The University of New Haven admits students of any race, color, national and ethnic origin to all the rights, privileges, programs, and activities generally accorded or made available to students at the University. It does not discriminate on the basis of race, color, national and ethnic origin in administration of its educational policies, admissions policies, scholarship and loan programs, and athletic and other school-administered programs.